

Introduction
Imagine a B2C startup. It’s small but profitable and growing.
To be fair it’s doing rather well. New users are registering daily. Revenue growth over 1000% year to year, putting the company straight in a spot comparable to the top 10 companies by revenue per employee.
How did we do that? Who are our main users? Where did they come from? Many questions to which we have no clue. Truth be told, we got this far with zero analytics, zero insights.
It’s past time to track people and their every moves.

Some numbers
We recently setup a log management solution so we have some numbers for sure.
3.591M HTTP requests per day on our frontends (cached and static contents are not served by these servers). Let’s consider this as page views and say that we want to track every page view
That’s 3.591M views per day, for which we want:
- IP
- city
- country
- user id
- page visited
- referer
- affiliate source (if any)
- device
- operating system
- date
How much storage does that take?
Some of the string fields can be more than 100 bytes. We’ll add more fields later (when we’ll figure what important stuff we forgot). Indexes and metadata take space on top of the actual data.
As a rule of thumb, let’s assume that each record is 1k on disk.
Thus the analytics data would take 3.6 GB per day (or 1314 GB pear year).
That’s a naive extrapolation. A non-naive plan would account for our traffic growing 5% month-to-month.
When accounting for our sustained growth, we’ll be generating 6.14 GB per day in one year from now. (At which point, the current year’s history will be consuming 1714 GB)
That quick estimation gives a rough approximation on the future volume of data. We’ll want to track more events in the future (e.g. sign-ups, deposits, withdrawals, cancellation), that shouldn’t affect the order of magnitude because page views are the most frequent actions by far. Let’s keep things simple, with a sane target.
Real Life Story
We remember the first attempt of the company at analytics. One dev decided to do analytics single-handedly, for real this time[1]! His first move was to create a new AWS instance with 50GB of disk and install PostgreSQL.
There wasn’t any forethought about what he was doing, the actual needs or the future capacity. A typical case of “just use PostgreSQL“.
In retrospect, that thing was bound to catastrophic failure (again! [1]) within the first month of going live and it was killed during the first design review, for good.
Then we started taking analytics seriously, as the hard problem that it is. We’ll summarize everything we’ve learnt on the way.
[1] That’s not the first attempt at analytics in the company.
Storage
Storage is a critical component of the analytics.
Spoiler alert: Expect a database of some sort.
What are the hard limits of SQL databases?
As always, the first choice is to take a look at SQL databases.
Competitors:
- PostgreSQL – 32 TB per table
- Microsoft SQL Server 2012 – 524272 TB
- MySQL 5.7 – 4 TB per table (on ext3 file system)
- MariaDB – 64 TB per table (less if filesystem maximum file size is less)
- Amazon RDS – 6 TB per table
- Oracle – No limitations given (Note: It seems to really NOT have hardcoded limits)
These numbers are hard limitations, at which point the database will stop accepting writes (and potentially destroy existing data). That gives a definitive indication of when RDBMS are out of their league. As a rule of thumb, it’s time to ditch open-source SQL databases when going over 1 TB.
Notice that the paid databases have significantly higher limits, they have smart storage engines splitting data across files (among other optimizations). Most of the open-source free databases are storing each table as a single file, suffering from the filesystem limitations plus additional hardcoded limitations of the software.
We need a system supporting sharding and replication. It’s critical to manage the sheer volume of data, to not suffer from a single point of failure, and (less important) to improve performances.
For once, relational databases are not the right tool for the job. Let’s look past them.
Note: We are not saying it’s impossible to achieve something with one of these SQL databases, just that it’s not worth the effort.
NoSQL Databases
Competitors: ElasticSearch, Cassandra, MongoDB[1], DynamoDB, BigTable.
The newer generation of NoSQL databases are easier to administer and to maintain. We can add resources and adjust capacity without downtime. When one instance fails, the cluster keeps working and we’re NOT paged at 3 AM. Any these NoSQL databases would be okay, they are similar to each other.
However to support horizontal scaling, these NoSQL databases had to drop “JOINS” support. Joins are mandatory to run complex queries and discover interesting things. That is a critical feature for analytics.
Thus NoSQL databases are not [the best] fit for the purpose of analytics. We need something with horizontal scaling AND joins. Let’s look further.
Note: We are not saying it’s impossible to achieve something with one of these NoSQL databases, just that it’s not worth the effort.
[1] Just kidding about MongoDB. Never use it. It’s poorly designed and too unreliable.
Data Warehouse Databases
Competitors: Hadoop, RedShift, BigQuery
There is a new generation of databases for “data warehouse“. They are meant to store and analyse truckload of data. Exactly what we want to do.
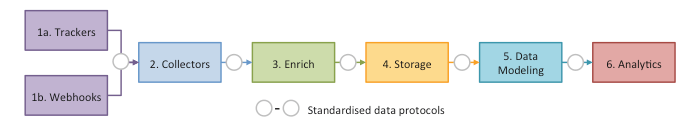
They have particular properties and limitations compared to traditional SQL and NoSQL databases:
- Data can only be appended in batch jobs
- Real time queries are not supported
RedShift interface is (mostly) standard SQL, BigQuery interface is a variation of SQL.
Note: Hadoop is a very different beast. It’s meant for Petabyte scale and it’s a lot more complex to setup and use. We’ll ignore Hadoop here.
Database Choice
The right tool for the job is RedShift or BigQuery.
We’re planning to run that thing on AWS so we’ll refer to RedShift storage for the rest of the article.
Client vs Server side analytics
Events are coming from various sources. A common question is client vs server side analytics, which one to do?
The answer is both! They are complementary.
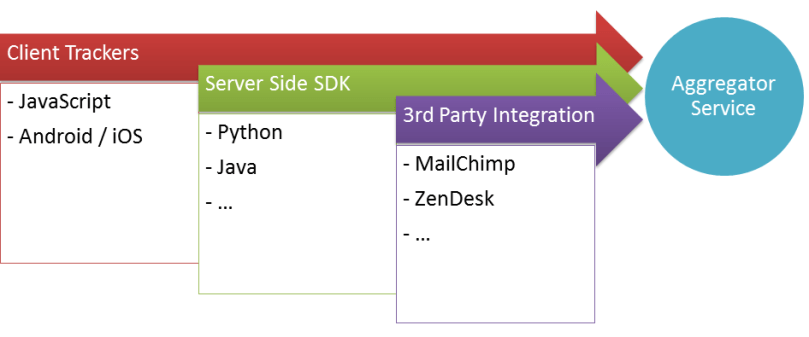
Client side analytics
It means that events are sent from the customer system, from the customer address. The most common example are JavaScript trackers, they run in the browser, in the customer environment.
The issue with client side scripts is that they run in the client environment and we can’t control it. First, a lot of customers are blocking trackers [1], we won’t receive any information about them. Second, the tracker endpoint must be publicly open, anyone can reverse engineer and flood it with meaningless data [2].
On the other hand, client side scripts are easy to do and they can get some information (e.g. mouse clicks) that are not available by any other means. So we should do client side analytics.
[1] 45% of users had blockers last year. It’s over 50% this year.
[2] As trivial as curling one million times “thesite.com/analytics.js?event=signup&email=bob@mail.com”
Server side analytics
It means that events are sent from our servers. For instance, when a customer registers an account, one of our application will receive the request and create the account in our database, this application could send a sign-up event to the analytics service.
Analytics services provide API for developers in the most common languages (Java, python, ruby…) to send events directly from the applications.
Server side analytics have higher quality data and they don’t suffer from poor internet connections.
It’s practical to track specifics events at the place where they happen. For instance, all our applications (website, android and iOS) are calling a single “account management microservice“. We can add one line to that service to track accounts at critical stages (signed-up, confirmed email, added an address).
Integrations
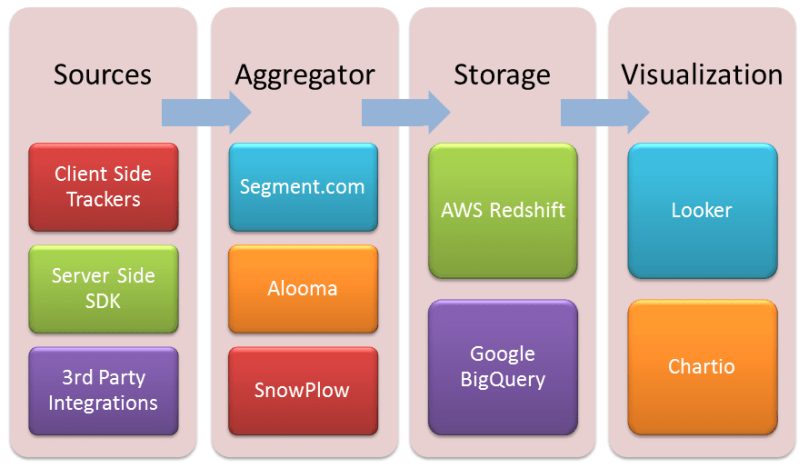
In the end, all analytics should be available in one place: Our new analytics system.
A good analytics system should import data directly from the most common services. In particular we want to import analytics from MailChimp and ZenDesk.
Events Aggregator
This service is responsible for receiving and aggregating events.
It has to be reliable and scale. It is responsible for providing APIs (client-side and server-side) and supporting third-party integrations. It saves events to the storage engine (need RedShift/BigQuery support).
This is the central (and difficult) point of the design.
Segment
The uncontested SaaS leader.
Historically, it was built as an abstraction API allowing to send analytics events to different services (Google Analytics, MixPanel, KissMetrics). It evolved into a complete platform, with hundreds of pluggable components (input source, storage engine and miscellaneous services).
Pros:
- No maintenance required
- Fully featured
- Support more than 100 inputs/outputs out of the box
- Cheap (for us)
Cons:
- Bad privacy policy (they sort-of reserve the right to resell everything)
- It forces sending all data to a third-party
- Possible regulations and privacy issues
If you’re starting with analytics, you should begin with Segment. You can see and query data right away. You can add other blocks later as your understanding of analytics improve and your needs evolve.
SnowPlow Analytics
The uncontested open-source free on-premise leader.
SnowPlow itself is an event pipeline. It comes with a bunch of API to send events (to one side of the pipeline). The output is written to RedShift (the other side of the pipeline).
As an open-source on-premise solution. We have to deploy and maintain the “pipeline” ourselves. The full guide is on GitHub.
In practice, that “pipeline” is a distributed system comprising 3-6 different applications written in different languages running on different platforms (keywords: elastic beanstalk, scala, kafka, hadoop and some more). It’s a clusterfuck and we are on our own to put it together and make it work. We found the barrier of entry to SnowPlow to be rather high.
Sadly, SnowPlow is alone in its market (on premise). There are no equivalent paid tools to do the exact same thing with a better architecture and an easier setup. We are cornered here. Either deal with the SnowPlow monster or go with a competitor (which are all cloud services).
Pros:
- Free (as in no money)
- On-premise
- Keep your data to yourself
Cons:
- A clusterfuck to setup and maintain
- Unclear capabilities[1] and roadmap
[1] Some critical components are marked as “not ready for production” in the documentation (as of September 2016).
Alooma
Alooma is a recent challenger that fits in a gap between the other players.
It comes with API and common integrations. It outputs data to RedShift.

Alooma itself is a real-time queuing system (based on kafka). Trackers, databases and scripts are components with an input and/or an output. They are arranged into the queuing system to form a complete pipeline. Fields and types can be mapped and converted automatically.
What makes Alooma special:
- Real time visualization of the queues
- Write custom python scripts to filter/transform fields[0]
- Automatic type mapping [0]
- Replay capabilities [0]
- Queue incoming messages on errors, resume processing later [0]
- Data is in-transit. It is not stored in Alooma [1]
- Clear data ownership and confidentiality terms
Under some jurisdictions, Alooma is not considered as “a third-party with whom you are sharing private personal identifiable information” because it doesn’t store data[1]. That means less legalese to deal with.
The topic of this post is building an Analytics pipeline. Technically speaking, it will always be a distributed queuing system (the best middleware for that purpose being Kafka) with trackers as input and database as output, plus special engineering to handle the hard problems[0].
That’s exactly what Alooma is selling. They made the dirty work and expose it with limited abstraction. It’s easy to understand and to integrate with. See the the 5 minute quick start video.
Pros:
- Simple. Essential features only. Limited abstraction.
- No maintenance required
- Modular
- Special middle ground between the other solutions
Cons:
- Limited integrations (only the most common at the moment)
A word on aggregators
SaaS is cheaper, easier to use and require no maintenance from us.
But we’d rather not go for SaaS because we don’t want to give all our data to a third-party. Especially private customer information (real name, address, email…). Especially when the service has clauses in the order of “We reserve the right to use, access and resell data to anyone for any purpose”.
On premise keeps the privacy and the control.
But all the on premise solutions are free open-source tools. We’d rather not go for that because it takes too much effort to deploy it and keep it running in production. Especially when the documentation is half-arsed and the software is only half-tested and missing major features.
There is no silver bullet here. We’ll have to compromise and find a mix of solutions to make something out.
Visualization
We have the data. We want to look at cute graphs and dashboards.
Some great tools emerged recently. We have solid options here.
Looker
The on-premise leader.
Unanimous positives reviews. One of the next unicorn to look for.
The main page has good screenshots. Try and see for yourself.

Looker is on-premise. We can open the firewall between the looker instances and our critical databases to run queries right away (security note: make a slave with a read-only account). There is no need to send any data to external actors.
ChartIO
The SaaS leader.
Same thing as Looker but in the Cloud.
See the 1 hour training video.
It can query many databases and services (including RedShift). The integrations require special access rights, the worst case scenario is to have the database accessible over a public IP (security note: lock down access to specific client IP with a firewall). There is a hard limitations on what can be reasonably opened to ChartIO.
Periscope
The cheap open-source free tools, as in do it yourself.
It’s just in the list for posterity. Not good enough. We’d rather spend money on Looker.
Final results
We have all the building blocks. Let’s play Lego!
Best in class externalized analytics pipeline

Special trick: No RedShift required. Segment stores everything in an internal SQL database and ChartIO can interface directly with it.
This solution has a very low price to entry, it’s easy to get going and it can evolve gradually.
Pros:
- Very easy to setup and get started
- Many integrations and possibilities
- Modular, start slowly and evolve over time
- No hardware or software to maintain
Cons:
- Everything is externalized
- Give all your data to third party
Pricing (approximate):
Segment is priced per unique user per month. The pricing increases linearly with the number of user, starting fairly low.
ChartIO used to be $99/month for startup, then $499. Not sure what it is now. Gotta speak to sales.
Note: Segment alone is enough to have a working solution. You can ignore ChartIO entirely if can live without the great visualizations (or can’t afford it).
Best in class (kinda) on-premise analytics solution
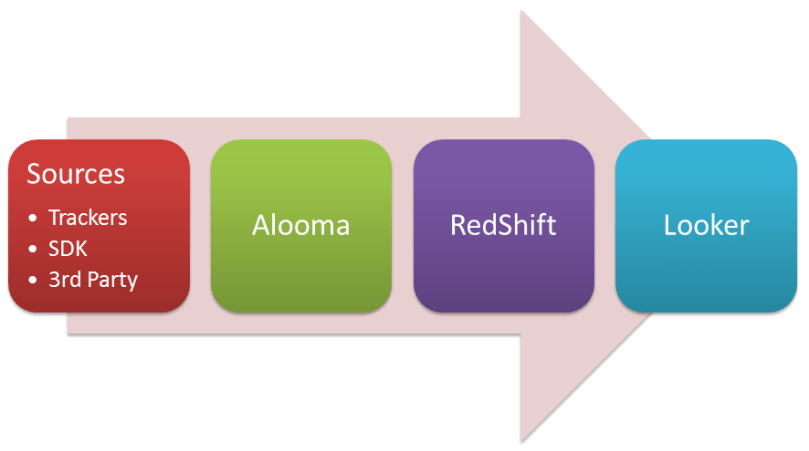
This solution is advised to bigger companies. It’s more expensive and requires more efforts upfront. The pricing doesn’t grow linearly with the amount of unique users making it advantageous for high volume sites. Looker can query production databases and make cross referencing right away, as it is on-premise sitting next to them[3][4].
Pros:
- Easy to setup and get started
- Modular, start slowly and evolve analytics over time
- No hardware or software to maintain
- Cover more advanced use cases and run special queries
- Query from internal databases out-of-the box[3]
- Analyse sensitive data without having to share them[4]
Cons:
- Need ALL the components up before it’s usable
- The price to entry is too high for small companies
Pricing (approximate):
Alooma. To quote a public conversation from the author “Alooma pricing varies greatly. Our customers are paying anywhere between $1000 and $15000 per month. Because the variance is so big, we prefer to have a conversation before providing a quote. There is a two weeks free trial though, to test things out“.
RedShift. The minimum is $216/month for an instance with 160GB of storage. The next bump is $684 for an instance with 2TB of storage. Then it goes on linearly by adding instances. (One instance is a hard minimum, think of it as the base price). Add a few percent for bandwidth and S3.
Looker is under “entreprisey” pricing. They announced a $65k/year standard price list the last time we talked to them. Expect more or less zeros depending on the size of your company. Prepare your sharks to negotiate.
Cheap open-source on-premise analytics solution
Each open-source tool taken separately is inferior to the paid equivalent in terms of features, maintenance, documentation AND polish. The combination of all of them is sub-par but we are presenting it anyway for the sake of history.
SnowPlow analytics + Luigi => redshift => periscope
Small company or lone man with no money and no resources? Forget about this stack and go for segment.com instead. Segment is two orders of magnitude easier to get going, it will save much time and give higher returns quicker. Your analytics can evolve gradually around Segment later (if necessary) as it is extremely modular.
Big company or funded startup in growth stage? Forget about this stack. The combined cost of hardware plus engineering time is more expensive than paying for the good tools right away. Not to mention that the good tools are better.
Personal Note: By now, it should be clear that we are biased again cheap open-source software. Please stop doing that and make great software that is worth paying for instead!
Conclusion
Analytics. Problem solved.
What was impossible 10 years ago and improbable 5 years ago is readily available today. In 5 years from now, people will laugh at how trivial analytics are.
Assembling the pipeline is half the road. The next step is to integrate existing systems with it. Well, time for us to get back to work.
Thank you for reading. Comments, questions and information are welcome.
References:
Streaming Messages from Kafka into RedShift in near Real-Time (Yelp Blog), the long journey of building a custom analytics pipeline at Yelp, similar to what building Alooma in-house would be.
Buffer’s New Data Architecture: How Redshift, Hadoop and Looker Help Us Analyze 500 Million Records in Seconds (Buffer Blog).
Building Out the SeatGeek Data Pipeline (SeatGeek Blog), The solution: Looker, RedShift, and Luigi.
Building Analytics at 500px (500px blog) + The discussion on Hacker News (Hacker News Comments), the discussion is mixing users and founders of various solutions, some of which are not discussed here.
Why we witches from mixpanel and segment to kiss metrics, information about other analytics services, that can complement what we recommend here.

[…] daily and saving the result to BigQuery/RedShift but it’s too much effort. We better go for a dedicated analytics solution, with a good data pipeline (i.e. NOT […]
LikeLike
I think you meant complementary, not complimentary (talking about Client vs Server side analytics)
LikeLike
Corrected. Thank you.
LikeLike