
Load balancers are the point of entrance to the datacenter. They are on the critical path to access anything and everything.
That give them some interesting characteristics. First, they are the most important thing to monitor in an infrastructure. Second, they are in a unique position to give insights not only about themselves but also about every service that they are backing.
There are two popular open-source software load balancers: HAProxy and nginx. Let’s see how they compare in this regard.
Enable monitoring on the load balancers
The title is self explanatory. It should be systematic for everything going to production.
- Install something new
- Enable stats and monitoring stuff
- Enable logs
Enabling nginx status page
Edit /etc/nginx/nginx.conf:
server {
    listen 0.0.0.0:6644;
    access_log off;

    allow 127.0.0.0/8;
    allow 10.0.0.0/8;
    deny all;

    location / {
         stub_status on;
    }
}
Enabling HAProxy stats page
Edit /etc/haproxy/haproxy.cfg:
listen stats 0.0.0.0:6427
    mode http
    maxconn 10
    no log

    acl network_allowed src 127.0.0.0/8
    acl network_allowed src 10.0.0.0/8
    tcp-request connection reject if !network_allowed

    stats enable
    stats uri /
Collecting metrics from the load balancer
There are standard monitoring solutions: datadog, signalfx, prometheus, graphite… [2]
These tools gather metrics from applications, servers and infrastructure. They allow to explore the metrics, graph them and send alerts.
Integrating the load balancers into our monitoring system is critical. We need to know about active clients, requests/s, error rate, etc…
Needless to say, the monitoring capabilities will be limited by what information is measured and provided by the load balancer.
[2] Sorted by order of awesomeness. Leftmost is better.
Metrics available from nginx
nginx provide only 7 different metrics.
Nginx only gives the sum, over all sites. It is NOT possible to get any number per site nor per application.
Active connections: The current number of active client connections
    including Waiting connections.
accepts: The total number of accepted client connections.
handled: The total number of handled connections. Generally, the
    parameter value is the same as accepts unless some resource
    limits have been reached (for example, the worker_connections limit).
requests: The total number of client requests.
Reading: The current number of connections where nginx is reading the
    request header.
Writing: The current number of connections where nginx is writing the
    response back to the client.
Waiting: The current number of idle client connections waiting for a request.
Source: https://nginx.org/en/docs/http/ngx_http_stub_status_module.html
Metrics available from haproxy
HAProxy provide 61 different metrics.
The numbers are given globally, per frontend and per backend (whichever makes sense). They are available on a human readable web page and in a raw CSV format.
0. pxname [LFBS]: proxy name
1. svname [LFBS]: service name (FRONTEND for frontend, BACKEND for backend,
any name for server/listener)
2. qcur [..BS]: current queued requests. For the backend this reports the
number queued without a server assigned.
3. qmax [..BS]: max value of qcur
4. scur [LFBS]: current sessions
5. smax [LFBS]: max sessions
6. slim [LFBS]: configured session limit
7. stot [LFBS]: cumulative number of connections
8. bin [LFBS]: bytes in
9. bout [LFBS]: bytes out
[...]
32. type [LFBS]: (0=frontend, 1=backend, 2=server, 3=socket/listener)
33. rate [.FBS]: number of sessions per second over last elapsed second
34. rate_lim [.F..]: configured limit on new sessions per second
35. rate_max [.FBS]: max number of new sessions per second
36. check_status [...S]: status of last health check, one of:
37. check_code [...S]: layer5-7 code, if available
38. check_duration [...S]: time in ms took to finish last health check
39. hrsp_1xx [.FBS]: http responses with 1xx code
40. hrsp_2xx [.FBS]: http responses with 2xx code
41. hrsp_3xx [.FBS]: http responses with 3xx code
42. hrsp_4xx [.FBS]: http responses with 4xx code
43. hrsp_5xx [.FBS]: http responses with 5xx code
44. hrsp_other [.FBS]: http responses with other codes (protocol error)
[...]
Source: http://www.haproxy.org/download/1.5/doc/configuration.txt
Monitoring the load balancer
The aforementioned metrics are used to generate a status on the running systems.
First, we’ll see what kind of status page is provided out-of-the-box by each load balancer. Then we’ll dive into third-party monitoring solutions.
nginx status page
The 7 nginx metrics are displayed on a human readable web page, accessible at 127.0.0.1:6644/

No kidding. This is what nginx considers a “status page“. WTF?!
It doesn’t display what applications are load balanced. It doesn’t display what servers are online (is there anything even running???). There is nothing to see on that page and it won’t help to debug any issue, ever.
HAProxy stats page
For comparison, let’s see the HAProxy monitoring page, accessible at 127.0.0.1:6427

Here we can see which servers are up or down, how much bandwidth is used, how many clients are connected and much more. That’s what monitoring is meant to be.
As an experienced sysadmin once told me: “This page is the most important thing in the universe.” [1]
Whenever something goes wonky. First, you open http://www.yoursite.com in a browser to see how bad it’s broken. Second, you open the HAProxy stats page to find what is broken. At this point, you’ve spot the source of the issue 90% of the time.
[0] This is especially true in environments where there is limited monitoring available, or worse, no monitoring tools at all. The status page is always here ready to help (and if it’s not, it’s only a few config lines away).
Integrating nginx with monitoring systems
All we can get are the 7 metrics from the web status page, of which only the requests/s is noteworthy. It’s not exposed in an API friendly format and it’s impossible to get numbers per site. The only hack we can do is parse the raw text, hopping no spacing will change in future versions.
Given that nginx doesn’t expose any useful information, none of the existing monitoring tools can integrate with it. When there is nothing to get, there is nothing to display and nothing to alert on.
Note: Some monitoring tools actually pretend to support nginx integrations. It means that they parse the text and extract the request/s number. That’s all they can get.
Integrating HAProxy with monitoring systems
In additional to the nice human readable monitoring page, all the HAProxy metrics are available in a CSV format. Tools can (and do) take advantage of it.
For instance, this is the default HAProxy dashboard provided by Datadog:
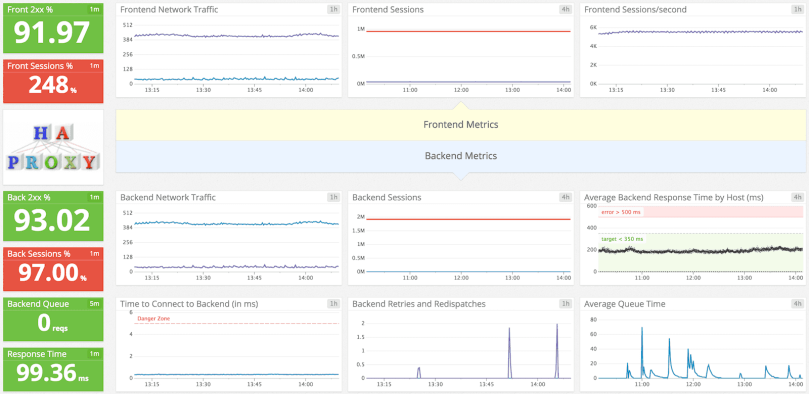
Source: http://docs.datadoghq.com/integrations/haproxy/
A Datadog agent installed on the host gathers the HAProxy metrics periodically. The metrics can be graphed, the graphs can be arranged into dashboards (this one is an example), and last but not least we can configure automatic alerts.
The HAProxy stats page gives the current status (at the time the page is generated) whereas the monitoring solution saves the history and allows for debugging back in time.
Why does nginx have no monitoring?
All monitoring capabilities are missing from nginx on purpose. They are not and will never be available for free. Period.
If you are already locked-in by nginx and you need a decent monitoring page and a JSON API for integrating, you will have to pay for the “Nginx Plus” edition. The price starts at $1900 per server per year.
See: https://www.nginx.com/products/pricing/
Conclusion: Avoid nginx at all costs
Load balancers are critical points of transit and the single most important things to monitor in an infrastructure.
Nginx stripped all monitoring features for the sake of money, while pretending to be open-source.
Being left entirely blind on our operations is not acceptable. Stay away from nginx. Use HAProxy instead.

What about Enterprise- or Carrier-grade SLBs? Sure they cost money but the feature set and performance are in a completely different league.
LikeLike
I am not sure what you mean with “Enterprise- or Carrier-grade SLBs”. Could you be more specific?
LikeLike
Dedicated appliances from companies like F5, Radware, etc..
LikeLike
For big enterprise running their own hardware. Buying F5 or Citrix NetScaler is the norm. It’s expensive hardware load balancer but its rock-solid.
They get 4 of them. One pair is publicly accessible, as entry point to the datacenter. Another pair is internal only, to balance backend services.
The cheaper appliances (from other vendors) are usually a HAProxy pre-installed on a normal server with a nice UI. It’s not much different from running HAProxy yourself.
LikeLiked by 1 person
KEMP devices as load balancing appliances are ok pricewise.
If you are putting nginx on frontend and concerned about status and metrics you can always
– build your own nginx with extended status
– go for tengine.taobao.org (Taobao version of nginx with a lot of additional features).
That is why it is called open source – if you are missing some feature, you can always add it yourself.
LikeLike
It is for the Open Core nature of NginX I incline towards lighttpd for general use, if Apache is not the option.
LikeLike
Today is 2016 and haproxy still lacks decent SMP support. Seriously?
LikeLike
Oh dear, this was a sadly biased post based on lack of facts… 😦 Seems there is more to nginx metrics in http://nginx.org/en/docs/http/ngx_http_status_module.html
LikeLiked by 1 person
Please read the first line of the page you just gave: “This module is available as part of our commercial subscription.”
As said in the article, you gotta pay nginx to get any form of metrics or monitoring, including the module you just linked ($1900 per server).
LikeLike
How about this free module? http://nginx.org/en/docs/http/ngx_http_stub_status_module.html
LikeLike
This module makes up the nginx status page I am talking about in the article.
It’s enabled with the option given at the beginning and it generates the page in screenshot “nginx status page”.
LikeLiked by 2 people
without metrics being the only criteria – why dont you actually evaluate Lb characteristics?
LikeLike
HAProxy more capabilities and more options. It really is a no brainer.
LikeLike
Just because something is open source, it doesn’t have to be (completely) free. Don’t confuse ‘fopen-source’ with ‘free software’.
https://en.wikipedia.org/wiki/Free_software
LikeLiked by 1 person
Is it fair to say avoid nginx at all costs when you are only talking about load balancing? What about as a Web server? Does it make sense to stick HAProxy in front of a few instances of nginx?
LikeLike
nginx is fine as a web server. It’s a web server that was originally intended to substitute to Apache.
And yes, you’ll need a load balancer in front of the web servers and that’s where HAProxy comes in.
LikeLiked by 1 person
I have very little experience with load balancing and monitoring, but I need to do some basic load balancing for a hobby project. I found your post very informative, but I’m wondering if you can’t get monitoring for nginx with 3rd party modules?
https://github.com/yaoweibin/nginx_upstream_check_module
I found a recommendation for the above module and I’m wondering if that would solve the monitoring issue that you are having with nginx? I don’t know enough about the subject to evaluate it myself.
I was hoping to use nginx, because I anyway need it as a web server and having fewer moving parts and technologies seems preferable. Based on your post I’m thinking that haproxy might be worth learning, because I definitely don’t want to pay $1900 a year for a hobby project and having a load balancer without monitoring seems ludicrous.
LikeLike
You don’t need monitoring for a toy project. Just try things and see for yourself.
LikeLike
The above is not totally true.
We use this awesome module – https://github.com/vozlt/nginx-module-vts
And we get all the same as author posted about HAProxy.
I agree with the importance of the monitoring for LB, but this module solves all our requirements in it.
About integration with 3rd party monitoring tools, the module is able to provide same info in JSON, and we are actively working on grabbing that data on regular basis to InfluxDB to draw some nice graphs in Grafana.
Thanks,
Roman
LikeLiked by 1 person
Interesting!
Too bad you need to rebuild nginx to integrate the module.
LikeLike
Hello, actually maybe not – https://www.nginx.com/blog/dynamic-modules-nginx-1-9-11/
I did not try this solution with this module, it may require some modifications, but it is always possible to ask his author on github, he is pretty responsive.
LikeLiked by 2 people
Default packaged maintained nginx in Debian and ubuntu does not allow dynamically loaded modules, you have to compile from source. It’s an option, but at the point you need to build, it’d be worth monitoring that you wouldn’t be better off paying a few grand for commercial support (how much are most of us paid per-year?).
LikeLike
Note that it’s a few grand per server and per year.
LikeLike
News : Nginx Amplify resolve nginx monitoring, but at this time, It’s beta :p
https://www.nginx.com/amplify/
LikeLike
It’s pretty clear that you will need nginx plus to use it effectively.
LikeLike
Lol datadog. Maybe you are not running things at petabyte scale; You start to see pain points associated with push vs pull. I will vote for on-prem graphite/prometheus/TICK any day over dd.
If you aren’t doing fancy, dd will probably suite you more as its list of ever growing integration is probably gonna help you out.
Now can we talk about UDP LB?
LikeLike
datadog works fine at terabyte scale, I can’t agree more that the integrations are fantastic. graphite/prometheus are single node and none of their storage have sharding built in, I don’t know how you can even take them seriously.
Pulling metrics from the prometheus node doesn’t work past a toy project. Can’t pull metrics behind firewalls, can’t pull metrics not exposed on the network.
LikeLike
There’s “works” and then there’s “works at a reasonable price point”. Datadog is the former and definitely not the latter.
LikeLike
Surely, you can appreciate that different people have very different “reasonable” price points.
For instance, a guy who is running his web server for $10 on Digital Ocean and a company who is running a web server for $200 on AWS.
LikeLike
haproxy has to run health checks per thread, which is 48 parallel health checks on 3 16-core machines. That’s kind of silly.
Probably should update this post and evaluate traefik as another option.
LikeLike
Nginx has Amplify for good monitoring metrics
LikeLike
What about UDP support?
LikeLike
None of them support UDP.
LikeLike
UDP support was added to NGINX in the 1.9.13 release, March 2016
LikeLiked by 1 person
Added to the paid edition only.
Disclosure: You work at ngninx.
LikeLike
I’m not trying to be misleading or disingenuous; just correcting something that is factually incorrect. UDP support was added to NGINX open source in the 1.9.13 release in March 2016. The release notes are here: http://nginx.org/en/CHANGES and there’s more details here: https://www.nginx.com/blog/announcing-udp-load-balancing/
LikeLike
Correction: TCP and UDP protocols are available in the open source edition… if nginx is recompiled with custom flags.
LikeLike
>if nginx is recompiled with custom flags.
Nginx from official repo compiled with –with-stream module
Also as it is just configuration option (depends on whether you need this module or not) it is not fair to use this argument as a downside 😉 I would rather say that this is a feature to be able to get only modules that you need in the binnary. Is HA-proxy such flexible?
LikeLiked by 1 person
LOL
This is exactly the sort of shit that evaluation software have to do to push people to the premium edition. Don’t even pretend for one second that disabling features is a feature.
LikeLike
UDP support works in nginx stream module *but* you cannot preserve the source address with the free version so it’s kind of useless.
LikeLike
Yup, Its almost like they have a commercial conflict of interest isn’t it?
Although to be fair why re-invent the wheel?
Almost everyone uses LVS (Linux Virtual Server) for UDP because its fast, transparent and just works.
You can use LVS UDP in Layer 4 DR mode, 2 arm NAT or one arm NAT:
https://www.loadbalancer.org/blog/load-balancing-methods/#networkaddresstranslationnatloadbalancingmethodtwoarm
LikeLike
Please let me share a correction – you /can/ preserve the source IP address using NGINX’s proxy_bind configuration. This works identically between NGINX open source and NGINX Plus, applies to UDP and TCP traffic, and is described in detail here: https://www.nginx.com/blog/ip-transparency-direct-server-return-nginx-plus-transparent-proxy/ .
FWIW, other L7-proxy-based load balancers (such as HAProxy) use similar measures to preserve the source IP address at the network level.
LikeLike
agreed however I would however point out that in this annoying world of ours its how fast you can reconfigure the services after logging has found errors thats what matters the ability to fix things…
hence why F5 use TCL and scripting… to be quite honest the only way I can see this being done nicely is via DNS in haproxy
https://www.haproxy.com/blog/dns-service-discovery-haproxy/
regards
https://john.jones.name
LikeLike
I may agree that on-the-fly upstream servers list update without full reload of the configuration is the key feature for any load balancer, however both HA-proxy and Nginx have this in enterprise versions only. So both opensource nginx and HA-proxy are useless here. Traefic is our only hope 🙂
LikeLike
No, in haproxy everything is in the opensource version. The enterprise one contains backports from the next development version and add-on modules (like WAFs, dashboards and eye-candy stuff that pleases enterprise users). All core features have always been present in the opensource version.
LikeLike
Is this good as generic advice? It seems like it might be a little specific; although I’m unsure what and why to be so specific. (Perhaps this is important for HVT).
For example, why can’t you relocate the problem, largely ignore nginx LB and setup application or box-level streaming of logs to a central source? Log Nginx and aggregate those logs If there is something wrong at the load-balancer
You mentioned in comments Prometheus isn’t very good, but it helps power CloudFlare and they are pretty huge. source: https://drive.google.com/file/d/0BzRE_fwreoDQNzUybnRFOHpWZTA/view
I like the article, I’m glad you’ve shared.
I understand why others are unhappy about nginx blocking features (that should be compilable even if not on by default), but many orgs that are open-source either have always done this, or are moving towards that model because they need to be paid.
Part of me also feels like I get it from nginx side. They’ve worked super hard on their problem and nobody can really touch them, so why not offer clearly business-only features at a premium? Is their time worthless? Is $1500 too much?
It’s much less than a car, and I’m pretty sure there are other ways to get these metrics is what I’m saying. Perhaps there is something to be said for just managing one type of server.
LikeLike
nginx is a strictly less capable product when it comes to load balancing. It doesn’t matter how much it tries to charge and how many critical features are missing, it simply doesn’t hold the comparison against HAProxy that has them and is free.
If you have to choose between a car that’s $10000 dollar and the equivalent car from the direct competitor that’s half the price AND uses less fuel AND is cheaper to maintain. Which one do you pick? Do you care that the first manufacturer worked super hard?
Collect both. Application logs and load balancer logs. The application logs alone can’t help with half of the failure modes that needs to be monitored and debugged.
LikeLike
>nginx is a strictly less capable product when it comes to load balancing. It doesn’t matter how much it tries to charge and how many critical features are missing, it simply doesn’t hold the comparison against HAProxy that has them and is free.
I would say that this requires some proofs. It doesn’t look like so from my experience with both products.
LikeLike
You are right in that engineers should require proof, but experience counts as well…
A decent open source load balancer requires:
Seamless re-load, decent monitoring, decent maintenance modes and health checks, reliability, performance, community support & a large user base.
HAProxy has all of that + every feature you could think of…
NGINX doesn’t even come close.
In fact this blog post inspired me to write my own take on the subject…
Nginx vs HAProxy – a bit like comparing a 2CV with a Tesla?
LikeLike
It seams to me that there are two parallel realities currently 🙂
The first one is where people live discuss, contribute and use in Production the HAProxy and nginx is somewhere far far away and is installed on the some geeks home computers only to host their blogs :)))
I live in the second one however, where nginx is the top proven stable Load Balancer with elegant and simple but yet powerful event-based internal architecture (https://www.nginx.com/blog/inside-nginx-how-we-designed-for-performance-scale/) and no one ever heard about HAProxy – so yeah we know that it is present but why it is needed if we have nginx – I don’t know for sure :)))
Thank you for you Post, I’ve commented it too btw 🙂
However I suppose that currently in the Docker world both open source HAProxy and Nginx are not top projects. With microservices and Docker you need something more dynamic. So projects like traefic, istio, envy, fabio are thoes that needs to be discussed. Nginx Plus is trying to find his place in this new world with his On-The-Fly reconfiguration and Amplify and integration to Kubernetes as an ingress controller. Not sure about HAProxy though.
LikeLike
Disclaimer: You are affiliated to nginx and the poster you reply is affiliated to HAproxy. 😉
All the companies I have seen use both, except a few exceptions who got F5 (a vendor appliance starting at $100k a piece). Companies will always end up with HAProxy sooner or later because nginx doesn’t support TCP/TCP-SSL balancing.
Docker doesn’t ship with anything useful out of the box. None of the projects you mention have much momentum. Eventually, kubernetes will ship a solution and it will become the de facto standard.
LikeLiked by 1 person
Actually we are on AWS so in general we use AWS NLB for TCP balancing, however nginx has it too (proof – https://www.nginx.com/resources/admin-guide/nginx-tcp-ssl-termination/) and as we use consul+consul-template to manage nginx configs we will possibly move TCP load balancing to nginx in the future or maybe not. In general there is nothing interesting in the raw TCP balancing IMHO, as it is aways interesting to look inside of the protocol to be able to route traffic more flexibly, and to not break connections during upstream switching/failover/maintenance etc.
As for kubernetes ingress – native solution is not flexible and I think never will – they don’t have such priorities. btw HAProxy is there too – https://github.com/kubernetes/ingress-nginx/blob/master/docs/catalog.md.
My current favorite is Envoy (https://www.envoyproxy.io/) btw, not nginx (we are not considering currently to pay for 20+ instances $2000 each unfortunately)
LikeLike
There are many software that are TCP or TLS only, the world is bigger than http 1.1 servers. Reconfiguring doesn’t break connections contrary to what you think.
Routing can be achieved on different levels, depends what you use. Personally, I still recall “the horrible apache mess” with hundreds of maintainable rewrite rules added one by one manually over years.
Kubernetes should integrates ELB and Google Balancers for the cloud, and HAProxy for self hosted. Doens’t mean it’s easy though.
LikeLiked by 1 person
Docker does ship with native swarm since March 2017 using which you can load balance almost any service/port . Pretty basic and does not offer the flexibility of nginx/haproxy but works for simple and small installations fairly well. It basically uses ipvs underneath. All the projects Roman mentioned has lot of momentum especially traefik, and are increasingly used by lot more people facing challenge of dynamic behaviour of microservces. We used and liked haproxy a lot but for microservices, it just didnt cut it when it comes to on the fly config. Compared that to traefik, it was difficult to configure with go template in the beginning, but once properly set, we might have changed or restarted traefik 3-4 times in last 8 months with many services being added/changed/migrated etc. Also about ‘de facto’ standards, I would quote Tannebaum “”The nice thing about standards is that you have so many to choose from; furthermore, if you do not like any of them, you can just wait for next year’s model.””
LikeLiked by 1 person
Check out the section “The Blub Paradox” (about half-way through the essay) in Paul Graham’s Beating the Averages.
The TL;DR for it is, if you don’t know how to use feature X, that your system is missing it won’t appear to be a disadvantage to you. That doesn’t mean you aren’t actually at a disadvantage, it simply means you don’t know you are.
LikeLike
Good point on stats. I’m using haproxy but evaluating nginx for http2. I tried the free stats of nginx and hugely disappointed. I guess upgrading to haproxy 1.8 will support http2
LikeLike
Excuse my slightly aggressive response but – Amplify? Seriously?
Rely on a commercial cloud subscription service which (may or may not be free) and you have no control over? Read the terms and conditions link at the bottom – and think – Why is this cloud service currently free?
LikeLike
I am really in wonder what kind of status you can not collect based on log files. What you receive from status pages are just current status (numbers). Usually when something wrong happens the first questions are: When? and What? This fancy status pages will never answer the “when” question. You miss the point how important are the historic data. Just collect your log files in ELK or Graylog or Splunk.
Next: yes – SMP, but not only that.
HAProxy still live with the believe that it is better to close server side connections to “save some resources on servers”. This is a thinking from the “fork” era. Believe or not for short HTTP requests establishing of new TCP connection costs a lot. Nginx have a let say “work around” and can have something that I name “server pooling”. HAProxy have this in TODO list since 2013 ;-).
Now on the opposite side: proactive monitoring (health checks) of even nginx-plus is a joke compared with that in HAProxy. For example slow start do not work on administratively disabled upstream server – something that usually happens on new code deploy on upstream servers. HAProxy have in addition agent check which opens a lot more possibilities.
I have used for years nginx, nginx-plus and haproxy and there is no clear winner. I was frustrated from the “never use” – it is simply low biased.
LikeLiked by 2 people
The status pages generally aren’t fancy because they’re normally read by tools such as Prometheus, which also log the data. While in theory the data could just as well be logged through unstructured log messages stored in tools such as Graylog, in practice it’s considerably more efficient and easier to analyze metrics stored in a specialized time series database. When using such a system you do get the “when” information, and typically in much easier to read form (such as graphs) and with ability to do queries (“how often in the past six months has metric x exceeded 80% for more than 30 seconds?”). This is the reason we used both Graylog and Prometheus at my previous job.
“Saving resources on servers” not “thinking from the ‘fork’ era,” it’s current thinking. (Saving resources is the precise reason modern servers do not spawn a new process per request.) Just because we’re no longer using
forkdoesn’t mean that we no longer need to conserve resources, just that the resources under stress are different.In the case of connections, everybody is well aware that TCP (and much more so, TLS) connections are usually expensive to set up, as compared to the cost of sending a single request down an existing connection. But there are also costs with maintaining connections, particularly ones that are not being used. I can’t speak to your particular situation here since you didn’t describe it in detail, but in my (admittedly limited) experience neither HAProxy nor nginx is doing anything stupid when handling large numbers of connections.
LikeLike
I don’t want to say that the most wanted monitoring tool from the year 2018 is bad (Prometheus from what I saw in Internet) but taking the samples from the status page is not the best option from our experience. I’ve tested the nginx-vts-module -> prometheus-vts-exporter -> Prometheusm it does not look so useful as you migth suspect. You loos very important info in fact.
We went with access.log -> logstash -> influxdb -> grafana – this looks much better.
LikeLike
You can say it. Prometheus is terrible. The interface is a single page where you can write a database query and see the result graph. It’s by no mean a polished or finished product. It’s what you get if you write a debug page for your database query in a week.
IMO I recommend to throw away all this garbage* and pay for datadog. https://www.datadoghq.com/
*graphite, prometheus, grafana, influxdb, cacti, nagios, ganglia…
LikeLike
“You need some statements when you are defining 6 products garbage in just one sentence”
I think you have no experience on at least half of the products you mention as garbage. As an example, Influxdb is not anything comparable to Prometheus or Datadog. You can compare them with TICK stack, as a whole. Influxdb only deals with time series storage engine, and it is a rock solid product.*
*I am still using Influxdb for arbitrage in ms precision operations.
LikeLike
I have experience with all the products mentioned. They are pretty bad for monitoring.
LikeLike
I think we should differentiate monitoring with monitoring and monitoring.
Someone will say that you should have nagios/zabbix and the team of 10 well trained support ~monkeys~ ingeneers to continiously watch on the dashboard with some nice graphs and numbers and someone have only some automated actions to be fired when some metrics is above/below threshold like auto roll-back latest deploy or switch traffic to another datacenter or to launch one more container.
Dashboards is from 90th to me. But they useful in grafana to find some correlations in historical data collected from different sources with some events as annotations (btw does Datadog have such functionality like to draw annotation based on logs on the metrics gathered from load balancer?).
Datadog is just too expensive for us but probably fine for someone who are ready to pay 🙂
>*graphite, prometheus, grafana, influxdb, cacti, nagios, ganglia…
Unfortunately I’m to old to know the words cacti and ganglia, and the worst – nagios (is someone using them at all?), but why Prometheus+Grafana and TICK stack+Grafana are in your list I don’t know.
Also they don’t say Monitoring nowadays – they say Observability.
LikeLike
nagios was renamed to icinga a few years ago. It’s still pretty much used. The graphite* stack doesn’t support alerting so there is no choice but to deploy yet another tool.
I’m not sure what you mean, Datadog can tag metrics/events if that’s what you are asking for. It’s actually the only tool of the bunch that supports multi dimensional tagging. It’s also the only tool providing good visualization and analysis on the data.
* grafana only added an alerting feature in version 4, year 2017, which is pretty minimalistic.
LikeLike
Access logs serve a completely different purpose from server polling. In particular, it’s difficult to get information out of them such as “we’ve gone from 50 requests/second to 150 requests /second on just these three servers,” or “despite requests/second remaining the same, our CPU usage has tripled on server X.” Certain kinds of information like that also can’t be reliably delivered by logs. Do you really check to see if the log message with your CPU utilisation that you expected to get every ten seconds is now arriving every 12 seconds instead? Because that almost certainly indicates a problem with your server.
Generally you should be monitoring logs and server status gained from polling. And remember, your developers can put anything they want on the status page that’s being polled by Prometheus or any other tool.
LikeLike
At last somebody who tell the truth about HAproxy vs Nginx. There is lots of hype online about Nginx. I used HAproxy has a load balancer. It worked so well out of the box. It took me 2 days to set up. Conversely, I faced major problems with IFisEVIL of Nginx. I don’t trust nginx since I had problems with IFisevil.
LikeLike