
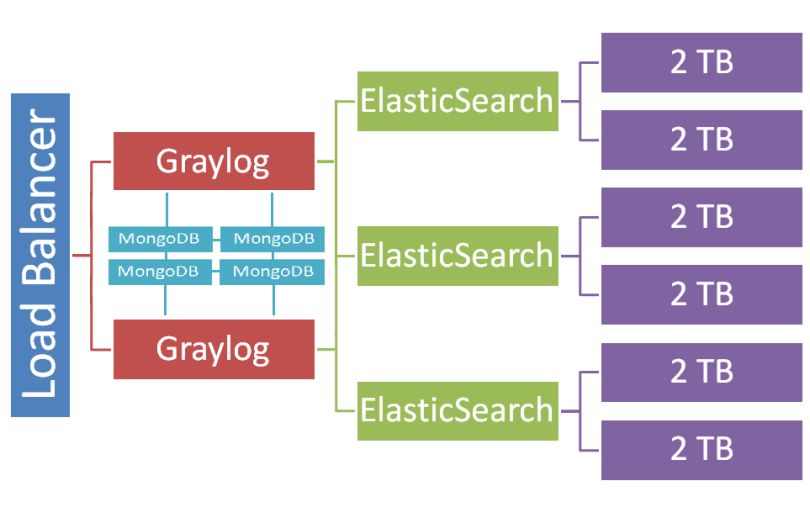
Architecture

- Load Balancer: Load balancer for log input (syslog, kafka, GELF, …)
- Graylog: Logs receiver and processor + Web interface
- ElasticSearch: Logs storage
- MongoDB: Configuration, user accounts and sessions storage
Costs Planning
Hardware requirements
- Graylog: 4 cores, 8 GB memory (4 GB heap)
- ElasticSearch: 8 cores, 60 GB memory (30 GB heap)
- MongoDB: 1 core, 2 GB memory (whatever comes cheap)
AWS bill
 + $ 1656 elasticsearch instances (r3.2xlarge)
 + $  108   EBS optimized option
 + $ 1320   12TB SSD EBS log storage
 + $  171 graylog instances (c4.xlarge)
 + $  100 mongodb instances (t2.small :D)
===========
 = $ 3355
 x    1.1 premium support
===========
 = $ 3690 per month on AWS
GCE bill
 + $  760 elasticsearch instances (n1-highmem-8)
 + $ 2040 12 TB SSD EBS log storage
 + $  201 graylog instances (n1-standard-4)
 + $   68 mongodb (g1-small :D)
===========
 = $ 3069 per month on GCE
GCE is 9% cheaper in total. Admire how the bare elasticsearch instances are 55% cheaper on GCE (ignoring the EBS flag and support options).
The gap is diminished by SSD volumes being more expensive on GGE than AWS ($0.17/GB vs $0.11/GB). This setup is a huge consumer of disk space. The higher disk pricing is eating part of the savings on instances.
Note: The GCE volume may deliver 3 times the IOPS and throughput of its AWS counterpart. You get what you pay for.
Capacity Planning
Performances (approximate)
- 1600 log/s average, over the day
- 5000 log/s sustained, during active hours
- 20000 log/s burst rate
Storage (as measured in production)
- 138 906 326 logs per day (averaged over the last 7 days)
- 2200 GB used, for 9 days of data
- 1800 bytes/log in average
Our current logs require 250 GB of space per day. 12 TB will allow for 36 days of log history (at 75% disk usage).
We want 30 days of searchable logs. Job done!
Competitors
ELK
Dunno, never seen it, never used it. Probably a lot of the same.
Splunk Licensing
The Splunk licence is based on the volume ingested in GB/day. Experience has taught us that we usually get what we pay for, therefore we love to pay for great expensive tools (note: ain’t saying splunk is awesome, don’t know, never used it). In the case of Splunk vs ELK vs Graylog. It’s hard to justify the enormous cost against two free tools which are seemingly okay.
We experienced a DoS an afternoon, a few weeks after our initial small setup: 8000 log/s for a few hours while we were planning for 800 log/s.
A few weeks later, the volume suddenly went up from 800 log/s to 4000 log/s again. This time because debug logs and postgre performance logs were both turned on in production. One team was tracking an Heisenbug while another team felt like doing some performance analysis. They didn’t bother to synchronise.
These unexpected events made two things clear. First, Graylog proved to be reliable and scalable during trial by fire. Second, log volumes are unpredictable and highly variable. A volume-based licensing is a highway to hell, we are so glad to not have had to put up with it.
Judging by the information on Splunk website, the license for our current setup would be in the order of $160k a year. OMFG!
How about the cloud solutions?
One word : No.
Two words: Strong No.
The amount of sensitive information and private user data available in logs make them the ultimate candidate for not being outsourced, at all, ever.
No amount of marketing from SumoLogic is gonna change that.
Note: We may to be legally forbidden to send our logs data to a third party. Even thought that would take a lawyer to confirm or deny it for sure.
Log management explained
Feel free to read “Graylog” as “<other solution>”. They’re all very similar with most of the same pros and cons.
What Graylog is good at
- debugging & postmortem
- security and activity analysis
- regulations
Good: debugging & postmortem
Logs allow to dive into what happened millisecond by millisecond. It’s the first and last resort tool when it comes to debugging issues in production.
That’s the main reason logs are critical in production. We NEED the logs to debug issues and keep the site running.
Good: activity analysis
Logs give an overview of the activity and the traffic. For instance, where are most frontend requests coming from? who connected to ssh recently?
Good: regulations
When we gotta have searchable logs and it’s not negotiable, we gotta have searchable logs and it’s not negotiable. #auditing
What Graylog is bad at
- (non trivial) analytics
- graphing and dashboards
- metrics (ala. graphite)
- alerting
Bad: (non trivial) Analytics
Facts:
1) ElasticSearch cannot do join nor processing (ala mapreduce)
2) Log fields have weak typing
3) [Many] applications send erroneous or poorly formatted data (e.g. nginx)
For instance, everyone knows that an HTTP status code is an integer. Well, not for nginx. It can log an upstream_status_code ‘200‘ or ‘–‘ or ‘503, 503, 503‘. Searching nginx logs is tricky and statistics are failing with NaN errors (Not a Number).
Elasticsearch itself has weak typing. It tries to detect field types automatically with variable success (i.e. systematic failure when receiving ambiguous data, defaulting to string type).
The only workaround is to write field processors to sanitize inputs but it’s cumbersome when facing an unlimited amount of applications, each own having different fields in need of a unique correction.
In the end, the poor input data can break simple searches. The inability to do joins prevents from running complex queries at all.
It would be possible to do analytics by sanitizing log data daily and saving the result to BigQuery/RedShift but it’s too much effort. We better go for a dedicated analytics solution, with a good data pipeline (i.e. NOT syslog).
Lesson learnt: Graylog doesn’t replace a full fledged analytics solution.
Bad: Graphing and dashboards
Graylog doesn’t support many kind of graphs. It’s either “how-many-logs-per-minute” or “see-most-common-values-of-that-field” in the past X minutes. (There will be more graphs as the product mature, hopefully). We could make dashboards but we’re lacking interesting graphs to put into them.
Update: Graylog v2 is out, it adds automatic geolocation of IP addresses and a map visualization widget. It is great.
Bad: Metrics and alerting
Graylog is not meant to handle metrics. It doesn’t gather metrics. The graphs and dashboards capabilities are too limited to make anything useful even if metrics were present. The alerting capability is [almost] non existent.
Lesson learnt: Graylog does NOT substitute to a monitoring system. It is not in competition with datadog and statsd.
Special configuration
ElasticSearch field data
indices.fielddata.cache.size: 20%
By design, field data are loaded in memory when needed and never evicted. They will fill the memory until OutOfMemory exception. It’s not a bug, it’s a feature.
It’s critical to configure a cache limit to stop that “feature“.
Reference: https://www.elastic.co/guide/en/elasticsearch/reference/current/circuit-breaker.html
ElasticSearch shards are overrated
elasticsearch_shards = 1
elasticsearch_replicas = 1
Shards allow to split an index logically into shards [a shard is equivalent to a virtual index]. Operations on an index are transparently distributed and aggregated across its shards. This architecture allows to scale horizontally by distributing shards across nodes.
Sharding makes sense when a system is designed to use a single [big] index. For instance, a 50 GB index for http://www.apopularforum.com can be split in 5 shards of 10GB and run on a 5 nodes cluster. (Note that a shard MUST fit in the java heap for good performances.)
Graylog (and ELK) have a special mode of operation (inherent to log handling) in where new indices are created periodically. Thus, there is no need to shard each individual index because the architecture is already sharded on a higher level (across indices).
Log retention MUST be based on size
Retention = retention criteria * maximum number of indexes in the cluster.
e.g. 1GB per index * 1000 indices = 1TB of logs are retained
The retention criteria can be a maximum time period [per index], a maximum size [per index], or a maximum document count [per index].
The ONLY viable retention criteria is to limit by maximum index size.
The other strategies are unpredictable and unreliable. Imagine a “fixed rotation every 1 hour” setting, the storage and memory usage of the index will vary widely at 2-3am, at daily peak time, and during a DDoS. In practice, they run over capacity sooner or later, potentially provoking a wide cluster failure.
MongoDB and small files
smallfiles: true
mongodb is used for storing settings, user accounts and tokens. It’s a small load that can be accommodated by small instances.
By default, mongodb is preallocating journals and database files. Running an empty database takes 5GB on disk (and indirectly memory for file caching and mmap).
The configuration to use smaller files (e.g. 128MB journal instead of 1024MB) is critical to run on small instances with little memory and little disk space.
ElasticSearch is awesome
ElasticSearch is the easiest database to setup and run in a cluster.
It’s easy to setup, it rebalances automatically, it shards, it scales, it can add/remove nodes at anytime. It’s awesome.
ElasticSearch drops consistency in favour of uptime. It will continue to operate in most circumstances (in ‘yellow’ or ‘red’ state, depending whether replica are available for recovering data) and try to self heal. In the meantime, it ignores the damages and works with a partial view.
As a consequence, elasticsearch is unsuitable for high-consistency use cases (e.g. managing money) which must stop on failure and provide transactional rollback. It’s awesome for everything else.
MongoDB is the worst database in the universe
There are extensive documentation about mongodb fucking up, being unreliable and destroying all data.
We came to a definitive conclusion after wasting spending lots of time with mongodb, in a clustered setup, in production. All the horrors about mongodb are real.
We stopped counting the bugs, the configuration issues, and the number of times the cluster got deadlocked or corrupted (sometimes both) during the setup.
Integrating with Graylog
The ugly unspoken truth of log management is that having a solution in place is only 20% of the work. Then most of the work is integrating applications and systems into it.Sadly, it has to be done one at a time.
JSON logs
The way to go is JSON logs. JSON format is clean, simple and well defined.
Reconfigure applications libraries to send JSON messages. Reconfigure middleware to log JSON messages.
nginx
log_format json_logs '{ '
 '"time_iso": "$time_iso8601",'

 '"server_host": "$host",'
 '"server_port": "$server_port",'
 '"server_pid": "$pid",'

 '"client_addr": "$remote_addr",'
 '"client_port": "$remote_port",'
 '"client_user": "$remote_user",'

 '"http_request_method": "$request_method",'
 '"http_request_uri": "$request_uri",'
 '"http_request_uri_normalized": "$uri",'
 '"http_request_args": "$args",'
 '"http_request_protocol": "$server_protocol",'
 '"http_request_length": "$request_length",'
 '"http_request_time": "$request_time",'

 '"ssl_protocol": "$ssl_protocol",'
 '"ssl_session_reused": "$ssl_session_reused",'

 '"http_header_cf_ip": "$http_cf_connecting_ip",'
 '"http_header_cf_country": "$http_cf_ipcountry",'
 '"http_header_cf_ray": "$http_cf_ray",'

 '"http_response_size": "$bytes_sent",'
 '"http_response_body_size": "$body_bytes_sent",'

 '"http_content_length": "$content_length",'
 '"http_content_type": "$content_type",'

 '"upstream_server": "$upstream_addr",'
 '"upstream_connect_time": "$upstream_connect_time",'
 '"upstream_header_time": "$upstream_header_time",'
 '"upstream_response_time": "$upstream_response_time",'
 '"upstream_response_length": "$upstream_response_length",'
 '"upstream_status": "$upstream_status",'

 '"http_status": "$status",'
 '"http_referer": "$http_referer",'
 '"http_user_agent": "$http_user_agent"'
 ' }';
access_log syslog:server=127.0.0.1,severity=notice json_logs;
 error_log syslog:server=127.0.0.1 warn;
syslog-ng
We use syslog-ng to deliver system logs to Graylog.
options {
 # log with microsecond precision
 ts-format(iso);
 frac-digits(6);

 # detect dead TCP connection
 mark-freq(5);

 # DNS failover
 time-reopen(10);
 dns-cache-expire(30);
 dns-cache-expire-failed(30);
}
destination d_graylog {
 # DNS balancing
 syslog("graylog-server.internal.brainshare.com" transport("tcp") port(1514));
};
Conclusion
It is perfectly normal to spend 10-20% of the infrastructure costs in monitoring.
Graylog is good. Elasticsearch is awesome. mongodb sucks. Splunk costs an arm (or two). Nothing new in the universe.
From now on and forward, all applications should log messages in JSON format. That’s the only way to be able to extract meaningful information.

Thank you so much. As a beginner this is really helpful. Trying to setup a cluster environment and hopefully it is smooth.
LikeLike
Gotta agree. I’m a noob and I NEED this type of information.
LikeLike
Interesting to see your nginx clip in there – you using that there instead of haproxy? (read this article after reading your nginx/haproxy bunfight one)
LikeLike
The nginx configuration given is to configure logging in JSON format, not to configure it as a load balancer for Graylog.
We don’t use a load balancer in our setup. syslog-ng has basic DNS balancing to relay logs. It picks a server from the pool graylog-server.internal.mycompany.com when it starts and it will failover to another server if the connection is lost. It’s basic but good enough.
LikeLike
nginx as json logs are not a good idea. You can just add a ‘ in the useragent or something like that and break the parsing.
LikeLike
Same as text logs. They’re parsed with regular expressions.
LikeLike
Have Nginx log key/value pairs to a syslog input and run the key/value extractor. End of the story.
LikeLike
Interesting take on sharding. Maybe my understanding is incorrect, but with a 3-node cluster, 1 shard and 1 replica, aren’t you going to have a node sitting there, with nothing on it? Does GL distribute the indexes after they’ve been cycled? Even if it does, aren’t you always going to be stuck with a ES node (in this instance) with one less index than the other two? Out of interest, how big were your indexes in this environment? I’ve just deployed a 6-node cluster (3 GL, 3 ES), with 3 shards and 1 replica. Each index is 90GB, which means each shard is within the 31GB limit (for each heap). I’m still unsure if this if the correct way to go. Everything I’ve read says the keep the number of indecies down, be that with a lower number of shards or a lower number of indecies. So far, my stress-testing has proved successful, although I have seen a search-performance hit since my indecies cycled (which I expected)!
Good read, either way. Thank you! 🙂
LikeLike
ElasticSearch distributes indexes onto all servers. It assigns a new index to the node(s) with the most free space. And whenever a node goes away (more than 5 minutes); it rebalances/rereplicates the damaged indexes onto all available nodes (a VERY intensive process when the dead node had TB of data).
30GB shards is way too much. I’d say to keep shards under 30% of the heap, and that’s being generous. The heap is not a file cache. It’s the entire memory given to ElasticSearch, only a small portion of which can be used for (various) caches.
A long time ago when I did log rotation based on duration. Indexes were ranging from 10GB to 100GB during rare high activity periods. Somewhere in the middle of that, the cluster would get dramatically slower; until it eventually stopped ingesting data altogether. I highly suspect the dramatic performance drop happened because the data couldn’t fit in memory anymore. It was systematic when the index got past a certain size.
LikeLike
Hi thehftguy, impressive article…
May I ask you, how many devices generates your 250GB a day?
LikeLike
About 200 VMs.
LikeLike
Very interesting read ! Are the three ES Servers data and master nodes at the same time ? I often came accross the opinion that is is a good idea to separate master nodes from data nodes, but don’t know if that is also the case in a Graylog environment.
LikeLike
Separating is a performance optimization for big deployments.
It’s not necessary. I don’t want to pay for 2 or 3 expensive instances just for that.
LikeLike
In the Graylog you can configure logstash input and use ES “*beats” to ship logs. This includes metricbeat which can give you performance stats.
LikeLike
Aw but you didn’t mention the core defect – size of index isn’t set in bytes but number of messages hence still quite unpredictable as x number of messages from source A doesn’t equal the same volume in bytes of same number of messages from source B, in my book that was the biggest disappointment since disks operate in bytes and not total messages per index * total number of indecies. IMHO guesrimasting those settings still exposes one to risk of filling up all storage
LikeLike
True.
That won’t work if your log messages vary greatly in length.
LikeLike
Indexes default to message size as the rotation strategy, but you can choose message size or time from the System/Indices >Edit button. Scroll down to near the bottom to find it.
LikeLike
Thank you!
LikeLike
FYI, I’ve regularly used Splunk since when it was new (2005-ish), and also ELK since some time.
you get what you pay for absolutely applies, so big are the differences in performance, reduced disk space needs and – most of all – so much better is the UI. While Kibana manages to look pretty similar, it has like 1% of the UX of Splunk. If I’d never used Splunk I would not mind, but as things are using ELK to me, personally, means I constantly subconsciously want to run away. It sucks so much in comparison.
But, obviously, Splunk’s pricing is not affordable in most cases. So all the benefits are not applicable.
It’s sad but we can be grateful there’s some free alternatives.
(btw, I ended up here thanks to a badly behaving ELK that uses up more CPU than the applications generating the logs…)
LikeLike
Maybe my understanding is incorrect, but with a 3-node cluster, 1 shard and 1 replica, aren’t you going to have a node sitting there, with nothing on it? Are the three ES Servers data and master nodes at the same time ?
LikeLike
The current index is using a master and a replica. Writes go to the master, reads go to both the master and the replica, the 3rd node is not used for that index.
Indexes are rotated periodically. They will be spread over all the nodes evenly. Any operation that involves more than one index will spread over the cluster.
LikeLike
Thank you so much!
Your setup experiences have given me so much insight into a current setup I’m doing my best to optimize!
LikeLike
Great article. I have some doubts about how to set up the index rotation and how it affects data access and most importantly, resource consumption.
Let’s assume the following setup: 3 ES instances with 24GB RAM each. 1 shard and 1 replica. Index rotation is set to 1GB and the policy is set to “Close” after 12 indices.
My assumptions:
* Only 12 indices will be kept open at any time, which means that 12GB of RAM will be in use across 2 ES hosts for keeping all this data in memory
* I would not be able to search any logs “older” than 12GB
* I would need to open indices in order to search logs “older” than 12GB and that will fully load the data into RAM, but this isn’t easily done (or possible) through the Graylog UI.
I really hope my assumption is proven wrong, as this would really kill us in the long run and I wouldn’t want to provision 250GB worth of RAM for the ES cluster just to be able to search in the past 24 hours (Assuming a 250GB/day log ingestion).
And honestly, the “Archiving” feature of the Enterprise edition doesn’t sounds so cool when you have to manage a ton of flat files…
LikeLike
* Data is spread evenly. You get 8GB of data per host (12GB index + 12GB replica / 3 hosts).
* Yes.
* Logs older than 12GB are deleted. They can’t be searched.
You only need enough memory to store the current index. ElasticSearch will load/unload previous indices dynamically when they are searches going through them. Searching is slower is you have little resources.
LikeLike
That makes much more sense now. In this case, I could set the indices to be a much higher number before they start to be deleted.
As a suggestion for the index size, in this case i can assume a size of about 30-40% of the memory, right? In the above example, that’d be 24GB x3 instances x0.40 / 2 due to replica = 14GB as index size before it gets rotated.
Thanks so much.
LikeLike
I also consume 250gb log per day. But I use only 3 server, 1 graylog and 2 elasticsearch.
LikeLike
Splunk is more than just a log system. We had an unlimited license but we were push/pulling from 6 different DC’s across the world. eg every transaction that went thou our database(card data truncated) F5s,firewalls,switch over 1200 VMs over 60 hosts 20 storage units. we were pulling about 1.8tb of logs a day. and a lot of they data was being sold back to one of our partners browser history trends recharge trends,speeding trends and more.
@ Spkunk guys we wont drink the bar tab empty this year 🙂
LikeLike
How long do your searches take when looking up millions of results in Splunk?
I’ve been running both Splunk and ElasticSearch extensively since I wrote this article few years ago and I find Splunk to be unbearably slow to search. The reporting and aggregation are really awesome but waiting tens of minutes kinda kills it for me.
LikeLike
What would you recommend as in resources and setup for graylog for about 50GB-60GB per day. i only plan to monitor some wireless networking equipment like controllers, and such. from many places but it may increase in the future.
LikeLike
Half the CPU, the memory and the disk. Should be fine.
LikeLike
Thank you a lot for the humor.
I wonder if you have read the Graylog documentation on the multi node topic and what is your opinion on their suggestions.
e.g. they suggest odd number MongoDB nodes, authentication is a must and not necessary to have a separate MongoDB node. Using Elastic HQ or Cerebro for metrics
I wonder where did you get the idea back when you were setting up this, can you suggest a place or two for the reference on how to optimize Graylog/ES/MongoDB?
Thanks
LikeLike